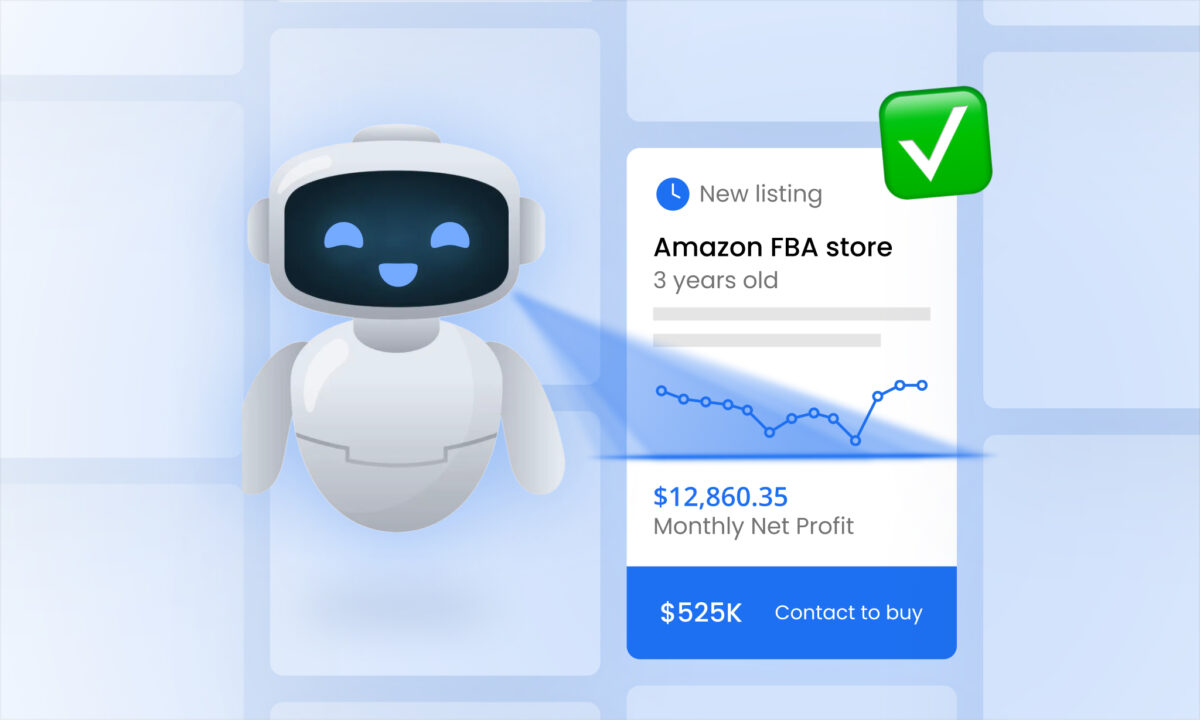
Buying an Amazon FBA business can be a fantastic investment – if you do your homework. Before you sign on the dotted line, it’s critical to analyze the business from every angle. Savvy buyers use tools (often simple spreadsheets and checklists) to dig into the numbers and metrics that matter. In this guide, we’ll break down how to evaluate an Amazon business’s financial health, performance metrics, and risks using tools you can create yourself, and highlight where a solution like sellerboard can help. By the end, you’ll know how to verify that an Amazon business is as good as it looks – and uncover any red flags before it’s too late.
Financial Analysis: Revenue, Profit and Margins
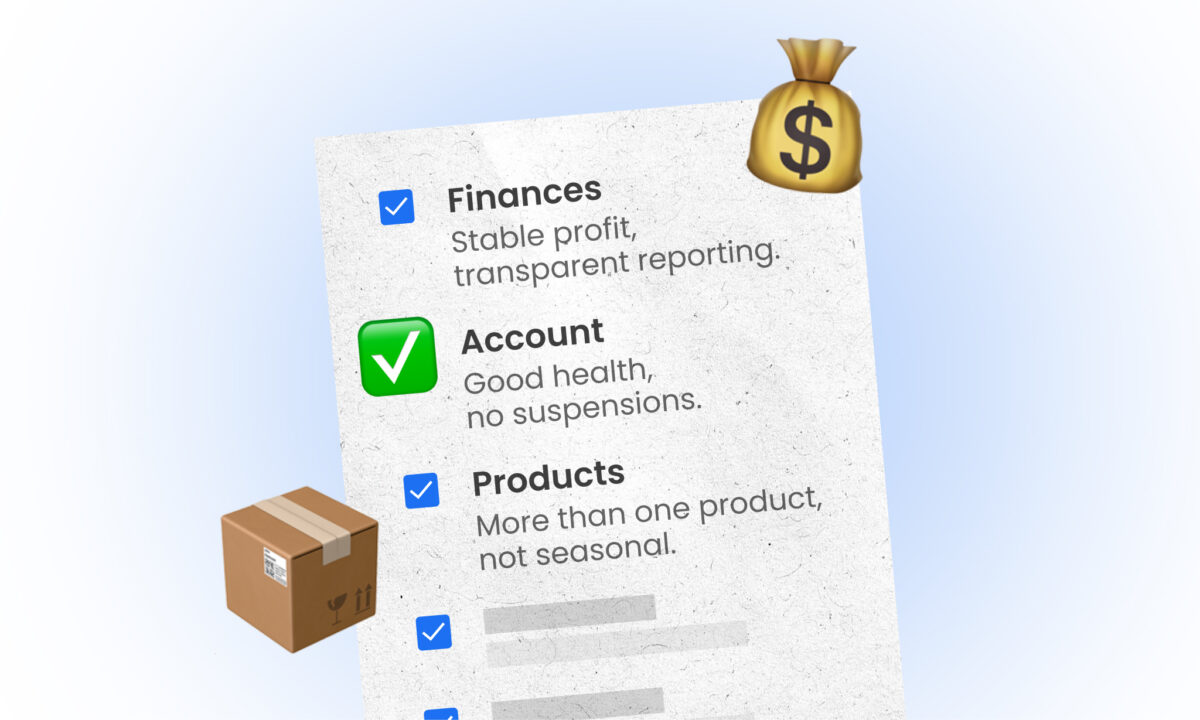
Start with the financials. A solid Amazon business should show consistent revenue and profit, clean financial records, strong profit margins, and sustainable growth. The best tool here is a profit-and-loss (P&L) spreadsheet. Ask the seller for detailed financial statements (ideally on an accrual basis for accuracy) and input the data into a spreadsheet so you can analyze trends and verify the figures.
Key things to examine in your financial analysis spreadsheet:
- Sales and Profit Trends: Look at monthly and yearly revenue and net profit. Is the business growing year-over-year? Plot these in a chart to spot trends. For example, if sales jumped 50% last Q4, is that due to seasonality or a one-time promotion? Seasonality can significantly impact an FBA business, so identify any seasonal spikes or slow periods and factor them into your expectations (a simple line graph with a trendline helps visualize this).
- Profit Margins: Calculate the gross and net profit margins. Amazon FBA businesses often run on net margins in the mid-teens (around 15–20% is common). If the net margin is much lower, find out why – is the seller overspending on ads or offering heavy discounts? A quick margins analysis in Excel (net profit divided by revenue) will reveal if margins are trending up or down over time. Consistently declining margins could signal rising costs or pricing pressure, a potential red flag.
- Clean Financial Records: Ensure the numbers add up. Verify revenue against Amazon payout reports or bank statements if possible. A useful spreadsheet exercise is to reconcile a few months of the seller’s reported sales with Amazon’s transaction reports. Any discrepancies? Small differences can occur due to timing, but large unexplained gaps are a warning sign. Accurate, transparent books indicate the seller runs a tight ship; messy or incomplete records could hide issues.
- Add-Backs and One-Time Costs: In your P&L sheet, identify any one-time expenses or owner-specific costs that the seller “adds back” to normalize profits (common in valuations). Make sure these adjustments are legitimate. Create a separate tab listing each add-back (like a trade show expense or one-off equipment purchase) and double-check the receipts or bank records. This tool helps ensure the Seller’s Discretionary Earnings (SDE) – the adjusted profit – is computed correctly. Since the purchase price often hinges on SDE, you want to be confident it’s accurate.
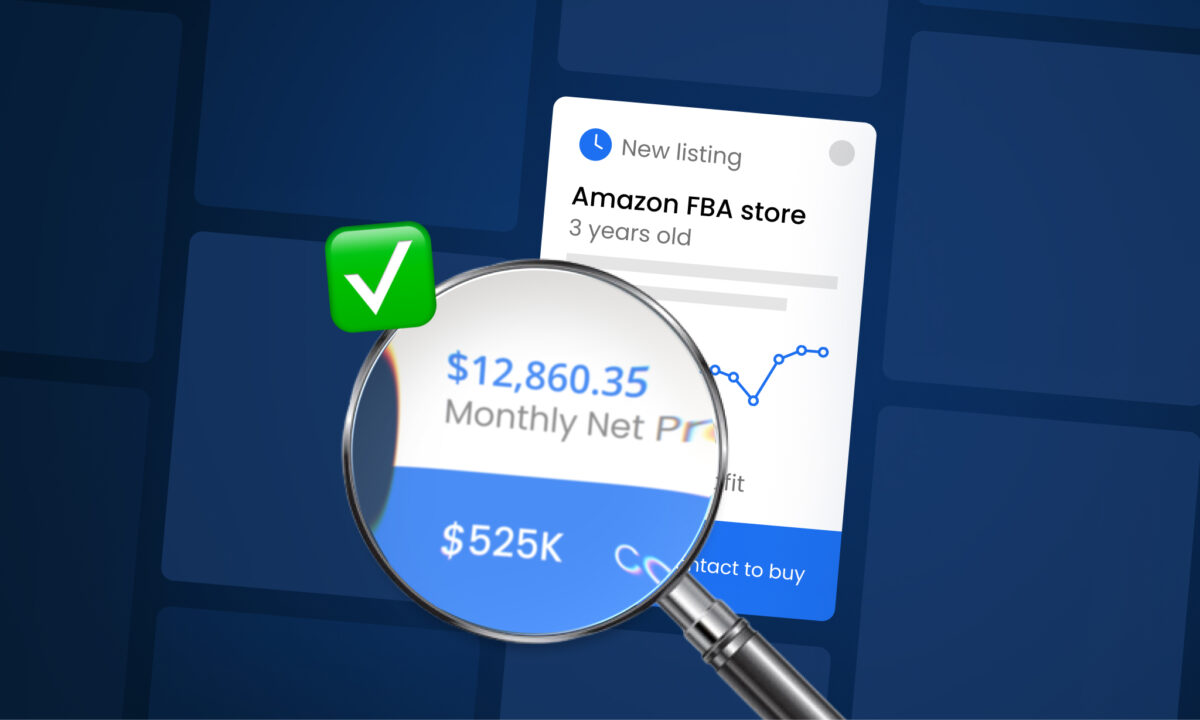
By scrutinizing the financials with your own spreadsheet model, you can validate the business’s earnings claims. If you have access to sellerboard, you can cross-verify these numbers easily – sellerboard integrates with Amazon to provide real-time profit analytics. In fact, some online business marketplaces (such as Exit.io) show “financial data from sellerboard” for listings, which gives buyers extra peace of mind that the profits are correctly calculated. Whether through sellerboard or your own Excel sheets, insist on data-driven verification of profits before you buy.
Sales Performance and Trend Analysis
Beyond raw revenue, dig into sales performance trends. A simple tool for this is a charts dashboard – which you can create in Google Sheets or Excel by plotting key metrics over time. Understanding how the business performs across different periods will tell you if it’s steadily growing, highly seasonal, or facing a recent slump.
Here’s how to analyze sales trends with DIY tools:
- Visualize Monthly Sales: Create a line chart of month-by-month gross sales for at least the past 12–24 months. This visual timeline makes patterns obvious. For instance, you might see steady growth or identify that every December sales double (indicating a holiday seasonal product). If you spot a sharp dip or spike, flag it and ask the seller for context (was it a stockout? a viral promo? an Amazon suspension?).
- Year-over-Year Comparison: If the business is over a year old, compare performance year-over-year for corresponding months or quarters. A quick way is to set up a pivot table summarizing sales by month for each year, then calculate the % change. This accounts for seasonality. If Q1 this year was 30% higher than Q1 last year, that’s a healthy growth sign. On the other hand, if growth has stalled or turned negative recently, you need to understand why.
- Product-wise Sales Distribution: Using a spreadsheet, break down sales by product or SKU. What percentage of revenue does each product contribute? This helps reveal if the business is over-reliant on a single product. For example, if one SKU is 80% of sales, the business has a concentration risk – you’ll want to scrutinize that product’s performance (and the stability of its supply and demand) extra carefully. A pie chart of revenue by product can quickly show diversification vs. dependence.
- Seasonality Impact: If your charts indicate clear seasonal patterns (e.g. a summer outdoor product or a Q4-heavy toy business), assess how that impacts cash flow and valuation. Seasonal businesses aren’t necessarily bad, but you should prepare for off-season lulls. One useful spreadsheet exercise is to compute the percentage of annual sales that occur in each quarter – if one quarter accounts for, say, 50% of sales, you know the business will require careful planning around that peak. Also, consider how seasonality affects valuation: buyers often pay slightly lower multiples for highly seasonal businesses due to the uneven cash flow.
By analyzing sales trends in a spreadsheet, you turn raw data into a story of the business’s trajectory. This helps you answer crucial questions: Is the business growing or shrinking? Is it steady or cyclical? The goal is to ensure you’re comfortable with the pattern of sales and can manage the business’s cycle post-acquisition. If creating these charts sounds daunting, note that sellerboard offers a “Trends” or chart view that automatically plots sales, profits, refunds, and other metrics over time – essentially acting as a built-in analytics dashboard. Whether manually or with software, don’t skip this step; understanding the sales story is key to making an informed buy decision.
Account Health & Performance Metrics
Amazon account health is the foundation of any FBA business – and a critical factor to examine before buying. Even a highly profitable Amazon store can come crashing down if the account gets suspended due to policy violations or poor performance metrics. The good news is that Amazon provides these metrics in the Seller Central dashboard, and you can document them in a simple checklist or spreadsheet for your analysis.
Be sure to review and record the following account health metrics:
- Seller Rating and Feedback: Check the seller’s rating (the one customers see on the storefront) and recent feedback comments. A strong seller rating (e.g. 4.8 stars out of 5) with mostly positive feedback indicates good customer service and fulfillment practices. If the rating is mediocre or there are consistent complaints (late shipments, product not as described, etc.), note it as a concern.
- Order Defect Rate (ODR): ODR is a key metric Amazon uses to gauge seller performance, and it must be below 1% to stay in Amazon’s good graces. This metric includes things like A-to-Z guarantee claims, negative feedback, and chargebacks. In your due diligence, an ODR of 0.5% vs. 0.9% is a subtle difference, but anything approaching or above 1% is a red flag – it means customers have had bad experiences. Log the ODR from the Account Health page into your checklist.
- Fulfillment Performance: If the business does any Merchant Fulfilled (FBM) orders (or could switch to FBM in emergencies), check metrics like Late Shipment Rate (<4% required), Pre-fulfillment Cancel Rate (<2.5% required), and Valid Tracking Rate (>95%). A well-run FBA business should have most orders handled by FBA, but it’s worth verifying there are no glaring fulfillment issues. If the seller ever self-fulfilled, make sure those metrics are within targets; otherwise, the account could be at risk of restrictions.
- Policy Compliance: Look for any policy warnings or violations on the account. These could be intellectual property complaints, product condition warnings, or other flags. Even if issues were resolved, document them. An account with a history of violations could be in jeopardy if another strike occurs. If you see an active warning (e.g. a restricted product policy warning), get clarification – you don’t want to inherit an account one policy infraction away from suspension.
- Inventory Performance Index (IPI): Amazon uses the IPI to measure how well a seller manages FBA inventory (factors like excess stock, sell-through rate, in-stock rate, etc.). A high IPI (generally 500 or above) is good – it means the seller is efficiently managing inventory according to Amazon’s standards. A low IPI could lead to storage limits. Include the current IPI score in your spreadsheet; while not a deal-breaker, it provides insight into inventory health and potential Amazon-imposed limits.
Use a checklist tool (spreadsheet or document) to record all these metrics along with the date observed. All metrics should ideally be within Amazon’s target thresholds. If they’re not, discuss with the seller and understand the plan for improvement. Account health issues are one area where no amount of financial due diligence can save you – if the Amazon account gets suspended, the business effectively stops. So treat this as a go/no-go checkpoint. The best scenario is an account with a clean bill of health and stellar performance metrics. Anything less, weigh the risk carefully. (Tip: sellerboard doesn’t manage account health metrics since those are on Amazon’s side, but it can alert you to things like sudden increases in refunds or returns, which often correlate with account health problems – another indirect way tools can help flag issues.)
Product Portfolio and Customer Reviews
An Amazon business isn’t just numbers on a spreadsheet – it’s built on products and customer trust. As a buyer, you need to analyze the product portfolio and the reputation those products have with customers. Here are tools and techniques to evaluate this side of the business:
- Product Performance Spreadsheet: Build a sheet that lists each SKU or ASIN, along with key data for each: total sales last 12 months, % of revenue, units sold, average selling price, gross profit margin per SKU, and the number of reviews with average star rating. This gives you a one-glance overview of the product landscape. Are one or two products generating the bulk of sales, or is revenue spread across many SKUs? Both scenarios have implications: a hero product can be a cash cow but also a single point of failure, while a diversified catalog is stable but may be harder to manage.
- Review Quality and Quantity: In your product spreadsheet, pay special attention to the reviews column. Strong review ratings (ideally 4+ stars) and a high number of reviews indicate a durable competitive moat – new competitors will struggle to match that social proof. If any top-selling product has an average rating below 4 stars, that’s a yellow flag. It means customer satisfaction is an issue, which could hurt conversion rates and invite competitors to steal market share with a better-rated offering. Dig into why the rating is low: are there quality issues mentioned repeatedly? Consider whether you can fix those post-acquisition. Also, note the total review count for each product – if the best seller has, say, 5,000 reviews, it’s a fortified position versus a product with only 50 reviews (which is easier for competitors to equal or surpass).
- Listing Quality Check: This isn’t exactly a spreadsheet task, but it’s an important manual check. Go through the Amazon listing of each key product. Are the listings well-optimized (clear titles, bullet points, A+ Content, high-quality images)? Are there any red flags like unaddressed negative reviews or customer questions? You might create a simple checklist to score each listing’s quality and note any obvious improvements you could make (which can be an upside opportunity post-sale).
- Competitive Analysis: Identify the top 3–5 competing products for each major SKU. You can note their prices, ratings, and review counts in your sheet to see how the business’s products stack up. For example, if your product has 1,000 reviews and a 4.5 star rating and competitors are all significantly lower, that’s a strong competitive advantage. Conversely, if a competitor (or Amazon’s own brand) has a similar product with better reviews or a lower price, you’ll want to account for that risk. While thorough market research might require specialized tools or extensive keyword analysis, even a quick competitor snapshot in a spreadsheet can highlight if the niche is crowded or if the business enjoys a unique niche.
By evaluating the product portfolio with these tools, you’ll gauge the strength of the brand and products you’re buying. Ideally, the business has products with solid demand, great reputation (reviews), and room to grow. Watch out for products on a decline (maybe evidenced by a downward trend in sales or rating) or products facing heavy competition. Remember, you’re not just buying past earnings – you’re buying future potential. A little manual research paired with organized notes can go a long way in revealing whether the products have staying power. (And if the seller uses a tool like sellerboard, you might ask for a product-by-product profitability report – this can save you time in building your own, and ensure you know which SKUs are truly driving profit after all fees and costs.)
Advertising and Marketing Efficiency
Most Amazon businesses rely on Pay-Per-Click (PPC) advertising to drive sales. Analyzing the business’s ad performance is another key piece of due diligence, as it directly affects profitability. You can use a spreadsheet to calculate a few important metrics from the advertising reports:
- ACoS and TACoS: ACoS (Advertising Cost of Sales) is ad spend divided by ad-attributed sales. TACoS (Total Advertising Cost of Sales) goes a step further – ad spend divided by total revenue. Request the last few months of Amazon Advertising reports or data from the seller. In a spreadsheet, compute the monthly ACoS for the top campaigns and the overall business TACoS. For many private-label FBA businesses, a TACoS in the 5–15% range is typical. If the TACoS is extremely high (say 30%+), the business may be over-reliant on ads to drive sales, which could be a risk if ad costs rise. Conversely, a very low ad spend could mean untapped growth potential (or it could mean the product ranks well organically – a positive sign).
- Advertising Trend: Plot ad spend and sales side by side over time. Are ads becoming more or less efficient? For example, if sales are flat but ad spend has doubled over the past year, profit is likely getting squeezed. A quick analysis: calculate the ratio of ad spend to sales each month and see if it’s trending upward (bad) or holding steady. Any big swings should be explained – maybe the seller launched a new product (spiking spend) or optimized campaigns (lowering spend).
- Campaign Structure & Branded vs. Generic: If possible, review how the seller structures their campaigns. This may be beyond a basic spreadsheet analysis, but you can at least ask for a summary or do a quick audit if given access. Efficient campaigns often have a high portion of spend on well-optimized manual campaigns targeting relevant keywords. If the ads are mostly automatic campaigns with high ACoS, you as a buyer might see an opportunity to improve. Make note of any quick wins you identify (e.g., pausing a clearly unprofitable ad group) – these can be points in your favor during negotiation or plans post-acquisition.
- Off-Amazon Marketing: Does the business do any marketing outside of Amazon (Facebook ads, Google, email marketing)? If yes, get performance data on those and include it in your analysis. Often, smaller FBA businesses rely solely on Amazon traffic, but some have external efforts. Treat any external spend like you did PPC – what’s the return on ad spend? For email lists or social media, those are assets that add value if used right. Document these marketing channels in a sheet (size of email list, social followers, etc.) to gauge how much “bonus” value they bring.
Assessing advertising efficiency is essential because ad spend is usually one of the largest expenses on the P&L for an FBA business. A company might have impressive revenue, but if 30–40% of that is being burned on ads, the net profit will suffer. On the flip side, a business that’s grown with minimal ad spend might have room to scale further by investing more into advertising. Using spreadsheets to calculate ACoS/TACoS and to parse the ad data will give you a clear picture of how well the seller has balanced buying growth vs. buying profit. If you’re not comfortable with this analysis, tools like sellerboard can assist – sellerboard pulls in ad costs and calculates profit after ad spend automatically, showing you metrics like ACOS per product and even per keyword. Either way, don’t overlook ad performance in your analysis toolbox, as it often explains the story behind the profit margin.
Operations, Inventory, and Supply Chain Check
An Amazon FBA business might appear simple on the surface (Amazon handles the packing and shipping), but the behind-the-scenes operations are crucial. You’ll want to analyze how the business manages inventory and suppliers, since these impact sustainability and growth. Create a simple “Operations & Supply Chain” spreadsheet or list to cover these areas:
- Supplier Details: List out the suppliers for each product. How many suppliers does the business use, and where are they located? A business sourcing all products from one reliable supplier can be very efficient – but it’s also a single point of failure if that supplier has issues. Alternatively, multiple suppliers can provide backup options but might be harder to manage. Note supplier terms (lead times, payment terms, MOQs) in your sheet. For example, if the lead time is 60 days and shipping by sea takes another 30, you know you’ll always need about 3 months of inventory on hand. Long lead times could mean large inventory orders (tying up capital), which is fine as long as it’s planned for.
- Inventory Turnover and Stock Levels: Ask for current inventory counts and the inventory purchasing history. You can calculate an inventory turnover ratio (cost of goods sold in a period divided by average inventory) or simpler: figure out how many months of inventory are on hand for each product. A quick formula in Excel: (Units in stock) / (average units sold per month) = Months of inventory available. If a product has, say, 12 months of stock sitting in FBA, that’s excessive and might indicate poor inventory management or a slowdown in sales. Excess inventory can be a hidden cost (storage fees, capital tie-up). On the other hand, if the business frequently stocks out (you might see sales dropped to zero for a period because inventory hit zero), that’s lost opportunity you’ll want to address if you take over. Look for a balanced inventory level – not too much dead stock, but not stockouts either.
- Logistics and Fulfillment Notes: Check if the business is FBA only, or if they also fulfill via other channels (FBM, 3PL, etc.). Note any specifics like: do they ship inventory by sea, air, or use Amazon’s warehousing restrictions? If the products are oversized or hazardous, there could be higher fees or special handling needed. Document these, since they can affect cost structure. For example, an oversized item will incur higher FBA fees – you’d want to verify those fees in the financials and possibly see if there’s a way to optimize (different packaging, etc.). If the business has a 3PL for storage or uses Amazon’s remote fulfillment, note those relationships and costs too.
- Operational Complexity: A business with dozens of SKUs in different categories requires different management than one with 2-3 SKUs in the same niche. In your analysis, consider the bandwidth needed to run the business. Are there standard operating procedures (SOPs) documented for tasks like reordering stock, customer service, listing optimization, etc.? If the seller has SOPs, request them (often they’ll provide those post-sale, but you can ask how well-documented their processes are). Having SOPs is a sign of a well-run operation and will make your life easier after purchase. You might simply add a note in your checklist: “SOPs provided? Y/N”. If no, be prepared for a steeper learning curve to operate the business.
Understanding the operational side with these tools helps you answer: Can I smoothly take over this business and continue to run it (or even improve it)? Sometimes a business looks great on paper but has behind-the-scenes headaches – maybe the seller is working 60 hours a week or constantly firefighting supplier issues. During due diligence discussions, ask about the owner’s weekly routine and pain points, and jot those down. If possible, get metrics like order defect rate from suppliers (e.g., how often inventory shipments have quality issues) – though this is often anecdotal. The main point is to not just buy the financial results, but also know what operational machinery produces those results. A well-organized spreadsheet or checklist of operational factors ensures you don’t overlook this aspect while focusing on the flashy revenue numbers.
Valuation and ROI Calculation Tools
Ultimately, your goal is to buy a business that will provide a return on your investment. After analyzing all the above, you’ll need to decide what the business is worth and whether the asking price is fair. Here’s where you can use a spreadsheet as a simple valuation and ROI calculator:
- SDE and Multiples: Most Amazon businesses are valued based on Seller’s Discretionary Earnings (annual net profit plus any add-backs). In a spreadsheet, input the TTM (trailing twelve months) profit, adjust for any add-backs you’ve verified, and you get the SDE. Now, apply a valuation multiple. For small FBA businesses, multiples might range anywhere from ~2.0x to 4.0x annual SDE (market conditions and business quality vary this). The seller may already have a price in mind which implies a certain multiple. Calculate that: Price / Annual Profit = Implied Multiple. Does that multiple seem justified given the business’s growth rate, niche, and risk profile? For example, if the business is asking $500,000 and the annual SDE is $100,000, that’s a 5x multiple – on the high side, only justifiable if the business is exceptional (rapid growth, strong brand, low risk). Use your earlier analysis to gauge this – high multiple should equal high quality across the board. If you find several red flags or heavy work needed, a high multiple is not justified.
- ROI and Payback Period: Another tab in your valuation sheet can project your return on investment. Essentially, how many months will it take for the business’s profits to pay back the purchase price? Compute Payback Period = (Purchase Price) / (Monthly Net Profit). For instance, if a business costs $120,000 and makes $5,000 in net profit per month, the payback period is 24 months. That’s actually quite good (2 years). If the payback is, say, 48 months (4 years) or more, ask yourself if the stability and growth prospects of the business make that worth it. Many buyers target a payback under 36 months, but each deal is unique. Also consider what you might do to improve the business after buying – if you see clear opportunities (e.g., reduce ad spend, expand products, etc.), you can potentially shorten the ROI period. It’s helpful to make a “best case / worst case” projection: one scenario where you grow the profit, and one where things stagnate or decline, to see how your ROI changes.
- Including Inventory in the Price: Be very clear on how inventory is handled in the sale. Some listings include the inventory value in the asking price; others say “plus inventory at cost”. If it’s the latter, you’ll pay extra for the inventory on hand. Incorporate this into your effective purchase price in the spreadsheet. For example, business asking $200k + $50k inventory means your true outlay is $250k. That will change your ROI math. Also, large inventory requirements mean more working capital needed going forward, which can affect your returns. A quick inventory valuation check: ensure the inventory you’re paying for is usable (not 2 years of unsellable excess). Compare inventory levels against sales velocity as discussed earlier so you aren’t buying a lot of dead stock.
- Benchmark Against Market Data: If you have access to any market reports or broker insights on typical valuations, you can benchmark the deal. Without naming other software or services, there are resources online that discuss average multiples for Amazon businesses of certain sizes. Use those as a sanity check, but always weight it against the specifics of this business. A high-quality business can command a premium; a shaky one should be discounted. Your spreadsheet can be a living document where you adjust the multiple up or down as you uncover strengths or weaknesses in due diligence. This helps you arrive at a fair offer.
Performing these valuation calculations not only guides your negotiation, but it also forces you to synthesize all aspects of the analysis into a dollar figure. If you’ve found a lot of issues (maybe low ratings, account risks, unstable earnings), your target multiple might be on the lower end. If everything looks excellent – diversified products, growing, minimal risks – you might be willing to pay a higher multiple. By playing with the numbers in a spreadsheet, you can see how different scenarios impact the value, which is incredibly useful for decision-making. Remember, tools like sellerboard can assist during this stage as well: having accurate profit data from sellerboard ensures your valuation is based on real, verified earnings, not optimistic assumptions. There’s nothing worse than overpaying because the profit was mis-stated; a rigorous analysis avoids that.
Red Flags to Watch Out For
Throughout your analysis, keep a keen eye out for red flags – signs that the business might be riskier than it appears. Here’s a checklist of common red flags you should note (and perhaps discuss with the seller or even walk away if severe):
– Inconsistent or Declining Financials: If revenue or profit has been trending downward for multiple months without a clear, fixable reason, be cautious. A one-time dip might be explainable, but a steady decline could indicate the product is losing market appeal or the niche is shrinking. Also, if the profit numbers don’t reconcile with Amazon disbursements or there’s any sign of “cooked books,” consider it a big red flag. Trust but verify every financial claim.
- Poor Account Health or Policy Risks: Any indication that the Amazon seller account is in jeopardy is a serious red flag. Multiple policy violations, a suspension history, or consistently high ODR/late shipment rates are risks that you, as the new owner, would inherit. The last thing you want is to buy an account that gets suspended a month later. If the seller has ever had an account suspension, dig into the details of how it was resolved and what safeguards are in place to prevent a repeat.
- Over-Reliance on a Single SKU or Amazon Program: If one product constitutes the vast majority of business, or if the business is heavily dependent on one Amazon program (for example, 90% of sales via Amazon UK, or all traffic via one high-ranking keyword), that concentration is risky. A change in Amazon’s algorithm or a single competitor can have outsized impact. Similarly, if the product’s success depends on something like being Amazon’s Choice or a specific ad placement, be wary – those can change overnight. A healthy business has a bit of cushion and diversification.
- Negative Product Feedback Trends: Are the products experiencing increasing negative reviews or a rising return rate? If customers are starting to complain more or returns are creeping up (perhaps due to quality issues or a design flaw), that needs attention. Sometimes sellers will launch a product that initially does well, but after enough customers use it, flaws emerge and reviews tank – essentially killing the product. Check the trajectory of recent reviews (this can be done manually by sorting reviews by recent on Amazon). If you see a wave of 1-star reviews lately, that’s a big red flag that the product has an unresolved issue.
- Unverified Claims or Lack of Documentation: If during due diligence the seller cannot provide documents to back up critical aspects (for example, no proof of trademark for the brand, no supplier agreements in writing, no evidence of certain expenses they claim), be cautious. A reputable seller will be organized and transparent. Any evasiveness or inconsistency in answers is a warning sign. It’s better to lose a deal than inherit a problem that wasn’t disclosed.
- Industry or External Risks: Consider any external risk factors. Is the product in a category facing regulatory changes or Amazon policy crackdowns? For instance, supplements or topical products might face compliance challenges. Or is the niche subject to trend risk (e.g., fidget spinners business in its twilight)? While these might be harder to quantify in a spreadsheet, make a note of any such qualitative risks as you uncover them. Sometimes a quick SWOT analysis (Strengths, Weaknesses, Opportunities, Threats) written out for the business can highlight these issues.
If one or more of these red flags are present, it doesn’t automatically kill the deal – but it should lower the valuation or prompt additional protections (like holdback payments, etc.). Importantly, discussing potential red flags with the seller can gauge their trustworthiness and cooperation. For example, a good seller will acknowledge a weakness and maybe outline how they think it can be mitigated. A bad one will dodge or downplay it. Use your checklist and instincts to judge. The whole point of due diligence is to surface these issues now, not after you’ve taken over.
Conclusion: Data-Driven Buying for Success
Analyzing an Amazon business before buying is an involved process, but it’s absolutely worth it. By leveraging spreadsheets, templates, and a healthy dose of skepticism, you turn what could be a risky leap into a calculated investment. We’ve covered how to dissect financial statements, chart out trends, evaluate the account health, scrutinize the product lineup, review advertising efficiency, and more – all using tools you can craft yourself with a bit of elbow grease.
Throughout this process, accuracy is paramount. Double-check everything. If something doesn’t make sense, ask questions or request further data. A serious seller will appreciate that you’re doing your due diligence. In fact, having organized data (from sources like sellerboard or well-kept financials) is a sign of a trustworthy seller. And don’t forget, tools like sellerboard can be your ally; they automate a lot of profit tracking and might already have much of the data you need – so take advantage if you have access.
Finally, remember to balance the qualitative feel of the business with the quantitative analysis. Numbers tell a story, but so do the intangibles like brand reputation and customer loyalty. When the qualitative and quantitative both look good, you likely have a winner. If either side raises concerns, weigh them carefully in your valuation or decide if you need to walk away.
Buying an Amazon business is an exciting step – you’re acquiring not just assets, but a working system that delivers products to customers. By using the tools and approaches outlined above, you’ll enter that acquisition with eyes wide open. In doing so, you increase your chances of securing a business that will reward you with steady profits and growth for years to come. Data doesn’t lie – so trust the process, do the work upfront, and you’ll be set up for success in your new Amazon venture.