Amazon FBA business valuations are entering a new phase in 2025, as rising fulfillment fees and advertising costs squeeze profit margins and alter what buyers are willing to pay for online brands. EBITDA multiples, which determine exit prices, are feeling the impact. In this article, we analyze how Amazon’s recent fee hikes and higher pay-per-click (PPC) costs are affecting EBITDA multiples, drawing on Sellerboard integration data and anonymized insights from real listings. We’ll also discuss what sellers can do to preserve value and how buyers are adjusting their calculations in this shifting landscape.
Amazon’s Rising FBA Fees: A New Cost Reality
Over the past few years, Amazon has steadily increased its Fulfillment by Amazon (FBA) fees, from storage and pick/pack charges to new surcharges. These changes accelerated in 2023 and 2024. In 2023 alone, Amazon rolled out a series of FBA fee hikes – fulfillment fees jumped by roughly 20% to 30% across many product categories, immediately tightening sellers’ profit margins. The introduction of dimensional weight pricing, fuel and inflation surcharges, and holiday peak fulfillment fees created a noticeably higher cost base for FBA sellers. By early 2024, Amazon’s own guidance acknowledged a further increase: on average FBA fulfillment fees were about 12% higher in 2024 compared to the prior year.
These rising fees affect nearly every Amazon seller since most rely on FBA’s warehousing and shipping. A standard 1-pound item that cost $3.48 to fulfill in 2020 had a fee of $5.06 by late 2022 – a 45% increase in just two years. Smaller items saw ~30% fee growth in that period, and even larger/heavier items became about 20% more expensive to fulfill. In short, Amazon is passing higher operational costs onto third-party sellers, who now face significantly higher expenses per unit shipped. Sellers can only absorb so much – eventually many have had to raise their prices to compensate, which can impact sales volume and competitiveness.
It’s not just fulfillment fees. Amazon also expanded storage-related fees (e.g. aged inventory surcharges, storage overage fees) and introduced new charges like inventory placement fees in 2024. The net effect is a more complex fee structure that demands efficient inventory management. Sellers who hold inventory too long or don’t optimize product dimensions face steep penalties that didn’t exist a few years ago. All these added costs mean that an Amazon business in 2025 spends more of its revenue on Amazon fees than it did in the past, directly reducing its gross and net margins.
Escalating Advertising Costs and PPC Spend
On top of fulfillment expenses, Amazon advertising costs have been climbing. Competition for ad placements is fierce, driving up the cost-per-click for Sponsored Products and other ad types. In 2024, Amazon’s average CPC (cost per click) hit record levels – the average CPC in June 2024 was about $1.14, the highest on record, and the overall average CPC in early 2025 is around $1.04 per click. For context, just a few years ago (prior to 2020) the typical CPC was only about $0.70. This means sellers now pay roughly 50% more per ad click than they did pre-2020, an increase that has outpaced many sellers’ revenue growth.
For Amazon FBA brands, advertising spend often makes the difference between profit and loss for a given product. Many private label sellers allocate 5–15% of their revenue to ads, and that percentage can double during aggressive launch phases or peak seasons. As CPC rates increase, the Advertising Cost of Sales (ACoS) – the share of revenue spent on ads – also increases if conversion rates stay constant. Unless the product’s conversion rate or average order value has grown, that higher ad spend cuts directly into margin.
In one anonymized FBA brand listing, the seller’s PPC spend in Q4 2024 was about 25% of sales (dummy data), up from 18% a year prior – a sizable hit to profitability. Such increases are common in competitive niches like supplements or home gadgets, where rising CPCs force sellers to either accept thinner profits or scale back ads (and risk losing market share).
Squeezed Margins and EBITDA Compression
The combined pressure of higher FBA fees and pricier ads has a clear outcome: profit margins are getting squeezed. Even if a business’s revenue is growing, its EBITDA may not be growing nearly as fast – it might even decline if costs outpace revenue gains.
Dummy example: Suppose an FBA brand did $1,000,000 in annual revenue in 2022 with a 20% net margin, yielding $200,000 in EBITDA. By 2025, that same brand might have grown revenue to $1,200,000, but if net margin fell to 15%, EBITDA would be $180,000. Despite 20% higher revenue, the annual profit is lower than it was in 2022.
Buyers and investors are aware of these margin trends. They now scrutinize a business’s financials for “margin resilience.” A model that naturally has slim margins is at greater risk when fees rise. For instance, reseller businesses often operate on thinner gross profit spreads after Amazon fees and competition, which means they feel cost increases immediately.
Even private-label brands, which typically enjoy higher margins, are not immune. Brands usually have more pricing power, but their profits are tempered by PPC and launch costs. A heavy reliance on paid ads to drive sales could be a red flag in this high-cost ad environment – it signals that if ad costs keep rising, the brand’s margins might fall further.
How Rising Costs Are Changing Valuation Multiples
Valuation multiples have started to reflect these cost pressures. During the FBA aggregator boom of 2020–2021, it was common to see 4×–6× EBITDA multiples. However, by mid-2024, average multiples settled around 5.2× EBITDA. Acquirers became far less likely to pay a premium for businesses with suspect unit economics.
It’s not that high-multiple deals are gone – premium brands in attractive categories can still command 7×–8× EBITDA in 2025. The difference is that those businesses usually combine strong growth with healthy margins and defensible market positions. Conversely, an average FBA business with stagnant profits is likely to trade closer to 4×–5× EBITDA.
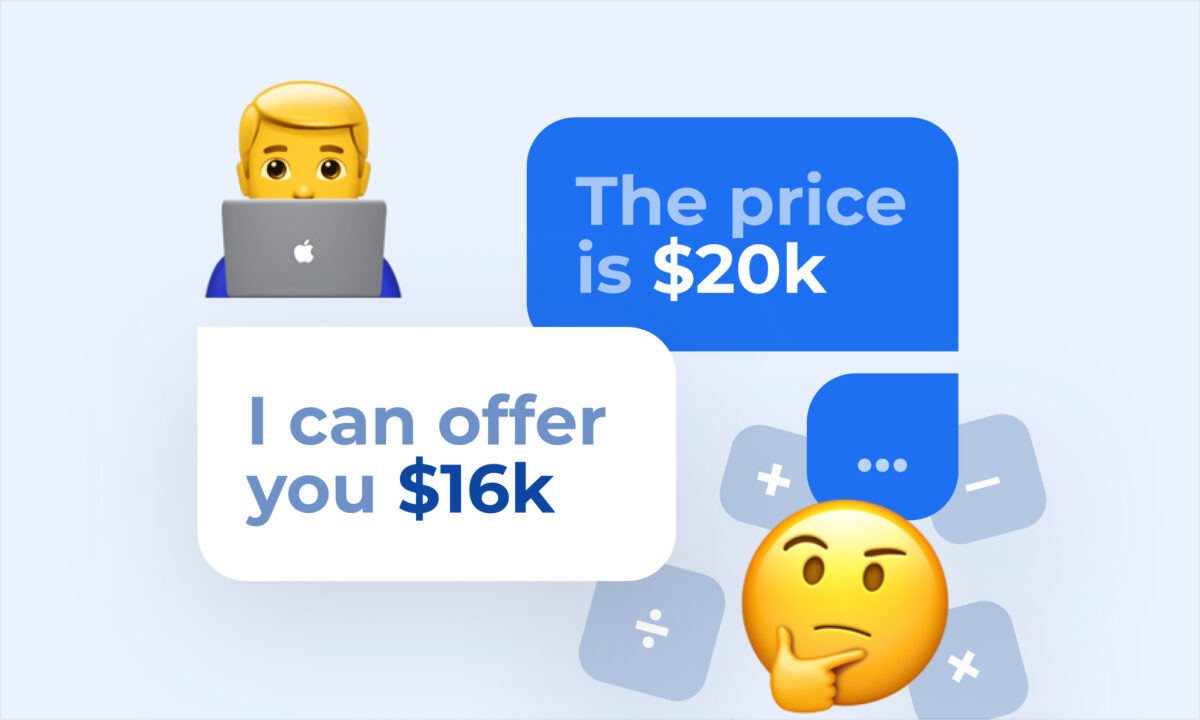
Dummy example: A buyer might offer 4.5× EBITDA for a business that would have fetched 5.5× a year prior, citing eroding margins. If Amazon announces another fee increase or industry CPCs climb again, buyers may further adjust their offers downward.
Strategies for Sellers: Preserving Value in a High-Cost Environment
1. Optimize Your Fee Profile
Audit your FBA fees and find ways to reduce them. Right-sizing packaging, avoiding oversized dimensions, and managing aged inventory can save tens of thousands annually. Every dollar saved in fees is a dollar added back to EBITDA — which increases exit value at any multiple.
2. Improve Ad Efficiency
Optimize campaigns: pause underperforming keywords, enhance listings for conversion, and reduce wasted spend. A declining ACoS, even amid rising CPCs, signals good management and supports a higher valuation.
3. Leverage Customer Loyalty and Organic Growth
Drive more sales through repeat customers and organic rankings to reduce ad spend dependency. Highlight strong repeat rates or subscribe-and-save adoption — these can justify a higher exit multiple.
4. Maintain Clean Financials with Full Cost Visibility
Use tools like Sellerboard to track all fees and show clean, normalized EBITDA. Buyers trust sellers who provide a clear, reconciled P&L and can explain their margin trajectory in the context of fee changes.
5. Show How You’ve Adapted
Demonstrate proactive steps taken to preserve margin: renegotiated supplier contracts, streamlined fulfillment, or product repricing. Buyers value businesses with a proven ability to adapt to Amazon’s evolving cost landscape.
What Buyers Are Watching For
Trend in Profit Margins
Are margins declining, flat, or improving? Buyers correlate dips with Amazon fee hikes to evaluate resilience.
Reliance on Advertising
What share of revenue is organic vs. paid? Heavily ad-dependent businesses are viewed as riskier.
Add-Back Cost Increases
Savvy buyers treat upcoming Amazon fee changes as reverse add-backs, anticipating future margin erosion.
Margin of Safety
How low can EBITDA go before the business becomes unattractive? Buyers now seek cushion — ideally 20%+ EBITDA margins.
Operational Efficiencies
Does the seller manage FBA costs well? If inefficiencies can be fixed post-acquisition, there may be value upside. But beware of overestimating “easy wins.”
How exit.io Helps
exit.io’s platform is built to bring transparency and data-driven decision-making to the acquisition process.
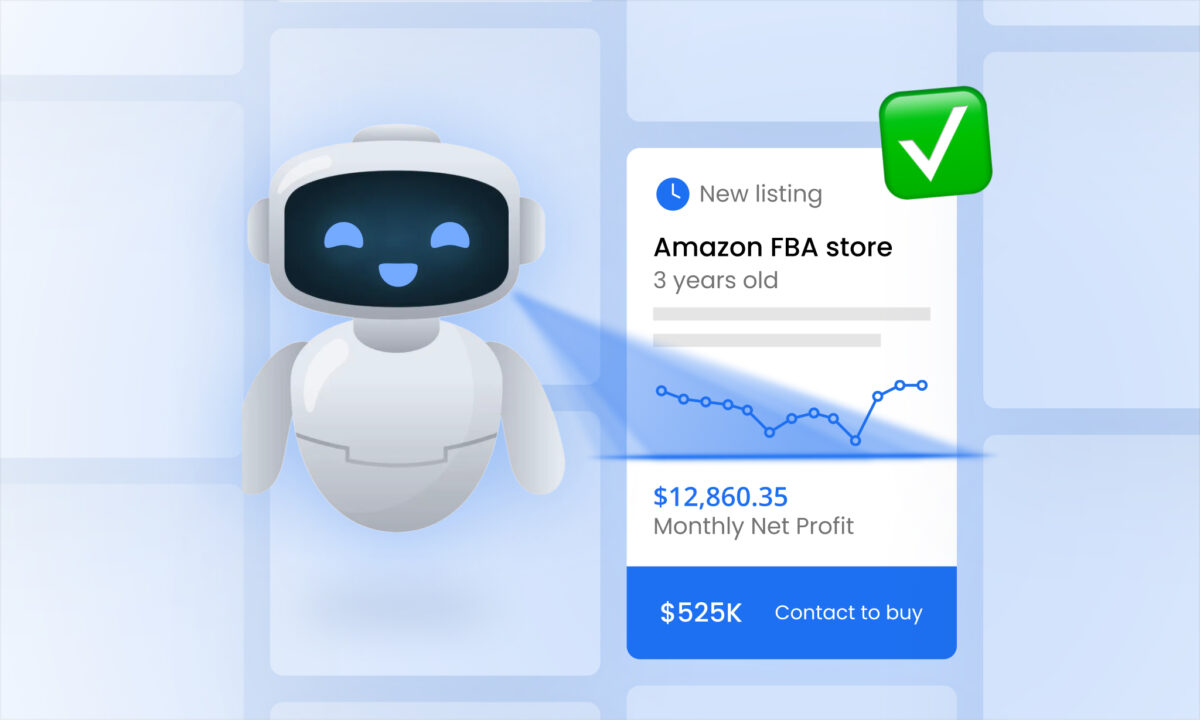
- For Sellers: You can list your FBA business and sync performance via Sellerboard, giving buyers a clear view of financials, including all Amazon fees and ad costs.
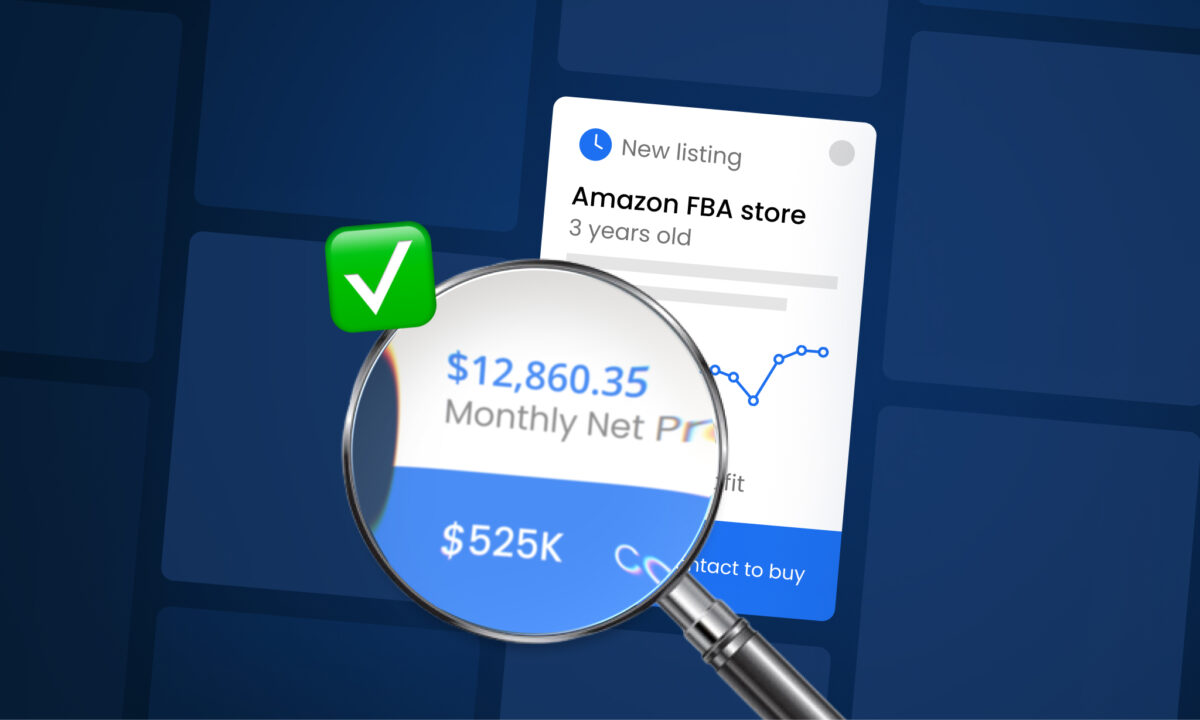
- For Buyers: Browse listings with real performance context. View revenue, EBITDA, and expenses — all clearly visualized — before diving into deeper due diligence.
As FBA costs rise, tools like Sellerboard and platforms like exit.io help ensure both sides can agree on a valuation grounded in real numbers — not guesswork.
Conclusion
Amazon’s new FBA fees and rising advertising costs are reshaping how exit prices are calculated. Sellers who adapt by improving efficiency and documenting margin stability can still command strong multiples. Buyers, in turn, are getting smarter and more data-driven, rewarding businesses that show true profitability and resilience. With the right tools and expectations, fair exits are still very achievable in 2025 — even in a higher-cost world.